Daily Practice Problems
Class 6 Maths
Data Handling
Class 6 Maths
Data Handling

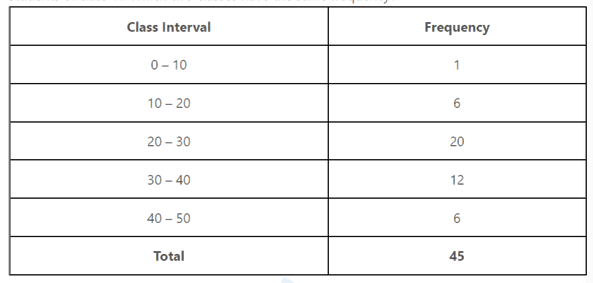
Question 1.
Following frequency distribution table shows marks (out of 50) obtained in English by 45 students of class VI. Which two classes have the same frequency?
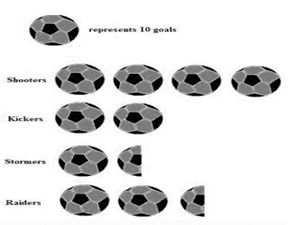
Question 2:
The pictograph shows the numbers of goals scored by four soccer teams in a season. How many goals did Kicker’s score?
Question 3:
A die was thrown 35 times and the following numbers were obtained:
5, 1, 4, 2, 3, 2, 6, 6, 1, 4, 2, 5, 4, 5, 3, 6, 1, 5
2, 6, 2, 5, 4, 1, 3, 2, 1, 4, 1, 6, 2, 6, 3, 3, 3
Prepare a frequency table for the data.
Question 4:
State true or false:
(a) A bar graph represents data in the form of pictures, object or parts of objects.
(b)Data is a collection of numerical figures giving required information.
(c)In a bar graph width of rectangle is always equal.
(d)The tally mark |||| represents 5.
Question 5:
Observe the following bar graph and answer the following questions:
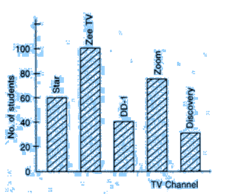
(a) How many students like Star channel?
(b) How many students like Zee TV channel?
(c) which TV channel is most liked?
(d) Which TV channel is liked by least number of students?
Question 6:
If O represents 5 eggs, how many eggs OOOO represent?
Question 7:
The bar graph shows the number of toys produced by a factory during a certain week:
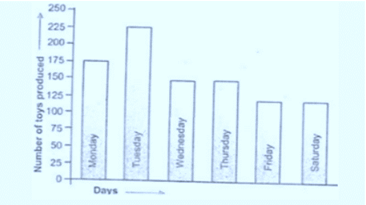
Answer the following questions:
(a) On which day the maximum number of toys were produced?
(b)On which day equal number of toys were produced?
(c)What is the total number of toys produced during the week?
(d)In which day minimum number of toys were produced?
Question 8:
A survey of 120 school students was done to find which activity they prefer to do in their free time:
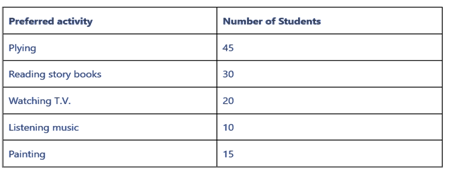
Draw a bar graph to illustrate the above data taking scale of 1 unit length = 5 students. Which activity is preferred by most of the students other than playing?
Question 9:
The below bar graph shows the monthly expenditure of Rajesh family on various household items.
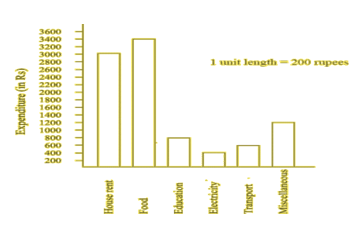
(a) Which item is taking the maximum expenditure?
(b) which item is taking the least expenditure?
(c) How much Rajesh spent on Food and transport?
Question 10:
Fill in the blanks.
(a) A ______ is a collection of numbers gathered to give some information
(b) A_________ represents data through pictures of objects
(c) The data can be arranged in a tabular form using _______ marks.
(d) __________ is method of representing data in uniform width size horizontal or vertical bar with equal spacing.
Question 11:
The below graph shows the total car in Bangalore city from 2014 to 2017
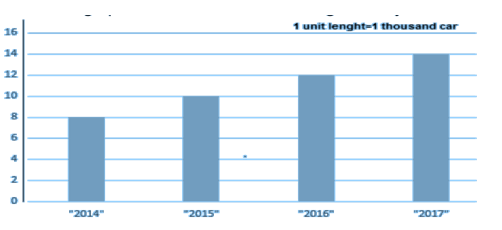
(a) What is the increase in total car from year 2015 to 2017?
(b) Which year has the minimum?
Question 12:
Students of class VI in a school were given a task to count the number of articles made of different materials in the school. The information collected by them is represented as follows:
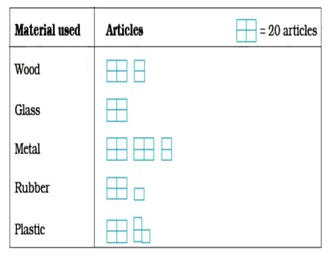
Observe the pictograph and answer the following questions:
(a) Which material is used in maximum number of articles?
(b) Which material is used in minimum number of articles?
(c) Which material is used in exactly half the numbers of articles as those made up of metal?
(d) What is the total number of articles counted by the students?
Question 13:
The following pictograph represents the data of the number of books sold in a week at a library. After analysing the graph answer the following questions:
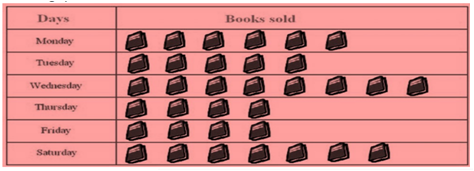
(a) Find the number of books sold on Wednesday.
(b) Find the day on which the maximum and minimum number of books are sold.
Question 14:
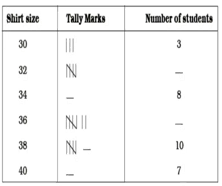
Fill in the blanks in the following table which represents shirt size of 40 students of a school.
Question 15:
The length in centimetres (to the nearest centimetre) of 30 carrots are given as follows:
15, 22, 21, 20, 22, 15, 15, 20, 20, 15, 20, 18, 20, 22, 21
20, 21, 18, 21, 18, 20, 18, 21, 18, 22, 20, 15 , 21, 18, 20.
Arrange the data given in the table using tally marks and answer the following questions:
(a) What is the number of carrots which have length more than 20 cm?
(b) Which length of the carrots occur maximum number of times? Minimum number of times.
Question 16:
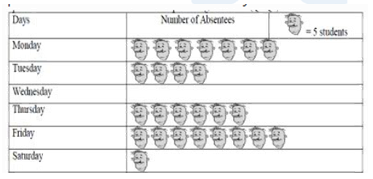
The following pictograph shows the number of absentees in a class of 50 students during the previous week. On which day were the maximum number of students absent?
Question 17:
The length in km (rounded to nearest hundred) of some major rivers of India is given below:
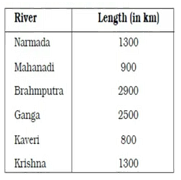
Draw a bar graph to represent the above information.
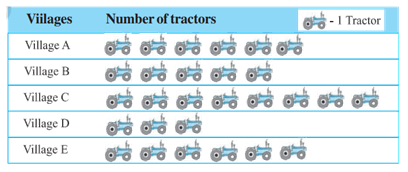
Question 18:
Observe the pictograph and answer the following questions.
(i) Which village has the minimum number of tractors?
(ii) Which village has the maximum number of tractors?
(iii) How many more tractors village C has as compared to village B.
(iv) What is the total number of tractors in all the five villages?
Questions 19:
In a village six fruit merchants sold the following number of fruit baskets in a particular season:

Observe this pictograph and answer the following questions:
a. Which merchant sold the maximum number of baskets?
b. How many fruit baskets were sold by Anwar?
c. The merchants who have sold 600 or more number of baskets are planning
to buy a godown for the next season. Can you name them?
Question 20:
The colours of fridges preferred by people living in a locality are shown by the following pictograph:
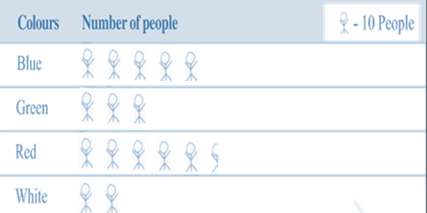
(a) Find the number of people preferring blue colour.
(b) How many people liked red colour?
**********
In summary, problem-solving after learning a theoretical concept on CBSE Data Handling Class 6 Maths is an essential part of the learning process. It enhances your understanding, critical thinking abilities, and retention of knowledge. Moreover, it equips you with valuable skills that are applicable in academic, personal, and professional contexts.
You must have heard of the phrase “Practice makes a man perfect”. Well, not just a man, practice indeed enhances perfection of every individual.
Practicing questions plays a pivotal role in achieving excellence in exams. Just as the adage goes, "Practice makes perfect," dedicating time to solve a diverse range of exam-related questions yields manifold benefits. Firstly, practicing questions allows students to familiarize themselves with the exam format and types of problems they might encounter. This familiarity instills confidence, reducing anxiety and improving performance on the actual exam day. Secondly, continuous practice sharpens problem-solving skills and enhances critical thinking, enabling students to approach complex problems with clarity and efficiency. Thirdly, it aids in identifying weak areas, allowing students to focus their efforts on improving specific topics. Moreover, practice aids in memory retention, as active engagement with the material reinforces learning. Regular practice also hones time management skills, ensuring that students can allocate appropriate time to each question during the exam. Overall, practicing questions not only boosts exam performance but also instills a deeper understanding of the subject matter, fostering a holistic and effective learning experience.
All About Daily Practice Problems on Class 6 Maths Data Handling NCERT Chapter 9
Our Daily Practice Problems (DPPs) offer a diverse range of question types, including Multiple Choice Questions (MCQs) as well as short and long answer types. These questions are categorized into Easy, Moderate, and Difficult levels, allowing students to gradually progress and challenge themselves accordingly. Additionally, comprehensive solutions are provided for each question, available for download in PDF format - Download pdf solutions as well as Download pdf Questions. This approach fosters a holistic learning experience, catering to different learning styles, promoting self-assessment, and improving problem-solving skills. With our well-structured DPPs, students can excel in exams while gaining a deeper understanding of the subject matter. Hope you found the content on Class 6 Maths Data Handling NCERT Chapter 9 useful.
Last but not least, to get the best hold on Class 6 Maths Data Handling NCERT Chapter 9, do not forget to check out: